Bundesliga predictions: Data overview
Yesterday, I wrote about predicting the next German Bundesliga (soccer) season with R. I will join a betting community of other scientists (#Scientipps). Today, I will give an outlook over the data I gained so far and which will be used to predict the first games. As written previously, the data is not fixed, maybe I will add some more information later on.
My data is taken from bulibox.de.
The site offers results from every matchday and the endtables of all seasons played so far (the Bundesliga was founded in 1963, so I will predict the 50th season).
I will use training data from the season 2000/01 until the season 2011/12 on.
That makes 12 seasons in total.
The Bundesliga has 18 teams, one season has two halfs, each team plays against each other twice.
The first game is played in the first half of the season, the second game (surprise!) in the second half.
The home team switches after the first game.
This makes 34 matchdays per season with nine games each.
Over all 12 seasons, this makes 3672 games.
Teams can relegate and be promoted.
This means that there are 29 teams over the 12 seasons.
Some teams relegated and did not promote again in recent years (e.g. Hansa Rostock, 1860 München, VfL Bochum, SpVgg Unterhaching), some promoted within the last few seasons (e.g. 1899 Hoffenheim, 1. FSV Mainz 05, FC Augsburg) and some teams went up and down over the last years (Borussia Mönchengladbach, Eintracht Frankfurt).
Fortuna Düsseldorf was in the first league for many years, the last season was 1996/97.
SpVgg Greuther Fürth promoted this year for the first time ever.
This means, it will not be possible to predict the games of these two teams.
FC Augsburg promoted last year for the first time, which means that there are only two games against each other teams as training data.
In fact, all other fixtures should have a good data basis.
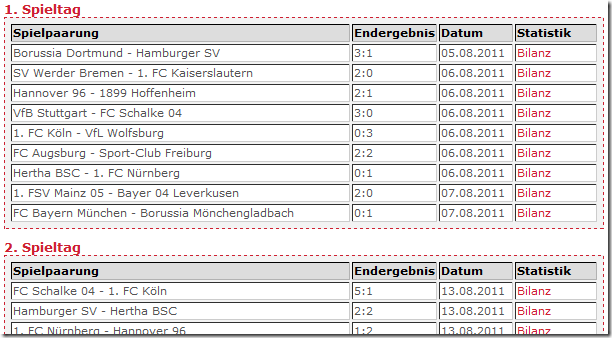
That should be enough as an introduction, for more info refer to wikipedia. Let’s get to the data. The matchday data looks like this:

The tables show the two teams playing against each other and the result of the game. This information and the matchday will be stored. Games can be tied, there is no overtime/extra time. I will take into account which team won and which team scored how many goals.
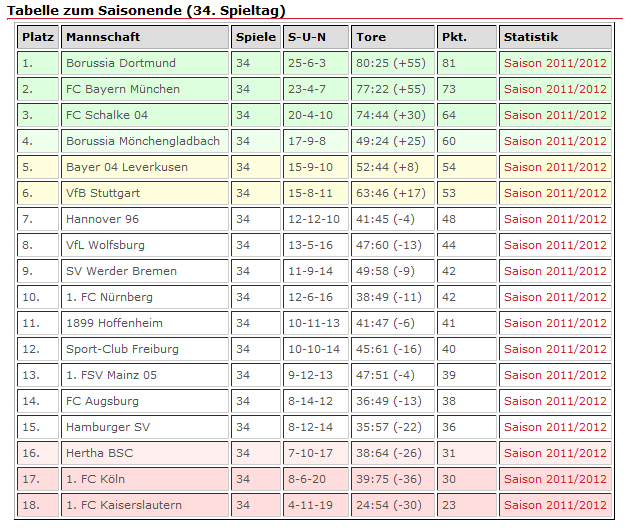
The endtable data looks like this:

From these tables, I will take into account the place, the total points compared to maximum points that could be reached (102) and the likelihood to win (compared against tied and lost games) of each team. I consider the three items as a kind of overall performance.
All seasons will be weighted, beginning from the first season with the lowest weight to the last season with the highest weight. I consider this as an item for medium- and long-term performance of the teams.</p>
That’s all to say about data so far. The next days, I will take a deeper look into the used algorithm.